Run a Chart Report
Users with the View WO Reports role permission can run a Chart Report. This report provides quick insight into the requests the user is able to view, such as requests by request type, priority, status, and by building.
You can make this report your homepage. In your profile, change the Homepage field to Chart Report.
To add a new Chart Report:
- Select Reports > Chart Report. The Chart Report page appears.
- Click + Add Chart. New fields appear.
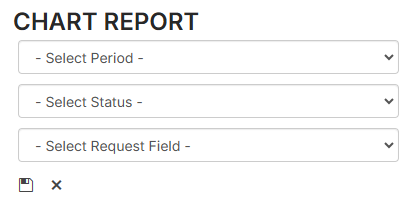
- Do the following:
- Select the desired time Period.
- Select the desired Status.
- Select the desired Field.
- Click
 . The report output appears.
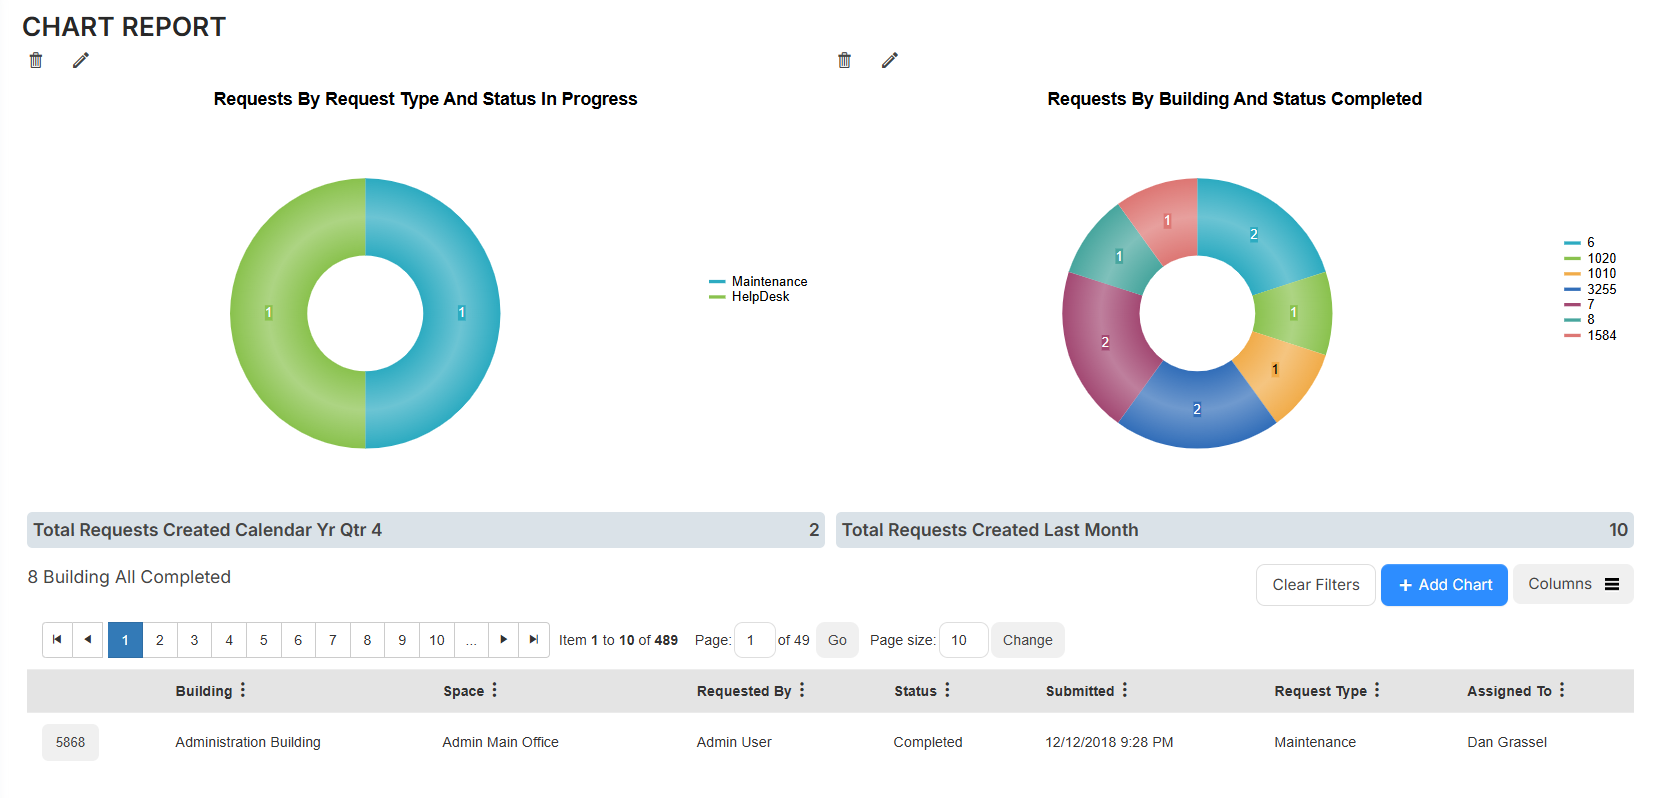
You can edit  or delete
  a chart report.
Click a section of a chart to show related requests below that chart.
To target the data listed below the charts, do any of the following:
| To... | Then... | |
|---|---|---|
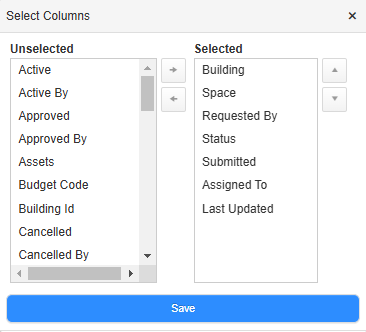
| Add or remove columns |
|
|
| Filter a column |
|
 .
.