View the Technology Asset Dashboard
Users with the Enhanced Reports administrative permission can view the Technology Asset Dashboard, which shows several data points at a glance. From any of the bar, column, pie, and line charts, you can drill down to get the information you need. You can also export the data to a PDF to save and share.
To view the Technology Asset Dashboard:
Select Reports > Technology Asset Dashboard.
To filter your results:
You can show a subset of data by clicking a section of either a pie chart or graph. All information within the report adjusts accordingly.
You can also use the filters on the upper-left side of the page.
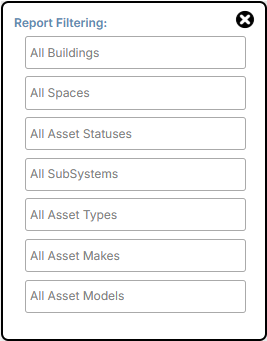
Click the filter you want, and then select from the drop-down.
The filter results appear in all the charts and graphs.
The Technology Summary Dashboard includes:
| Data | Related widget | |
|---|---|---|
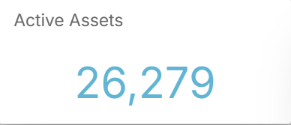
| Active assets |
|
|
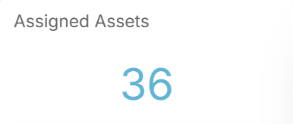
| Assets assigned to users |
|
|
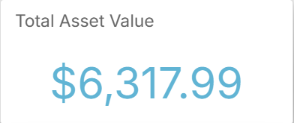
| Total asset value |
|
|
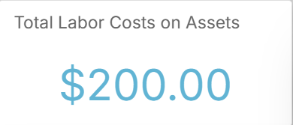
| Total labor costs on assets |
|
|
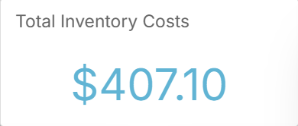
| Total inventory costs |
|
|
|
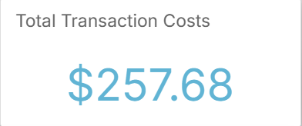
Total transaction costs
|
|
|
| Top 10 assets by number of requests | ||
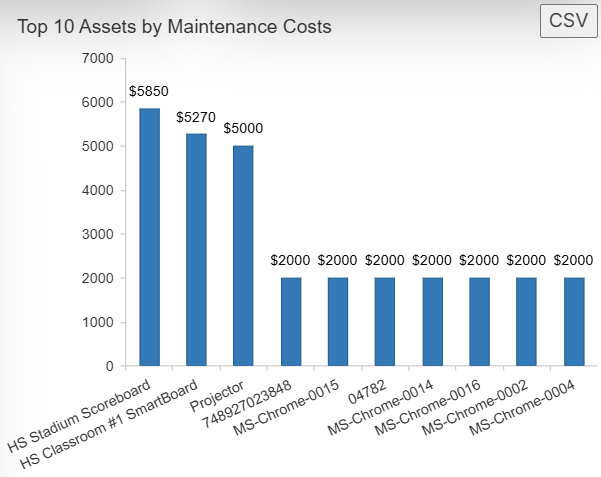
| Top 10 assets by maintenance costs |
|
|
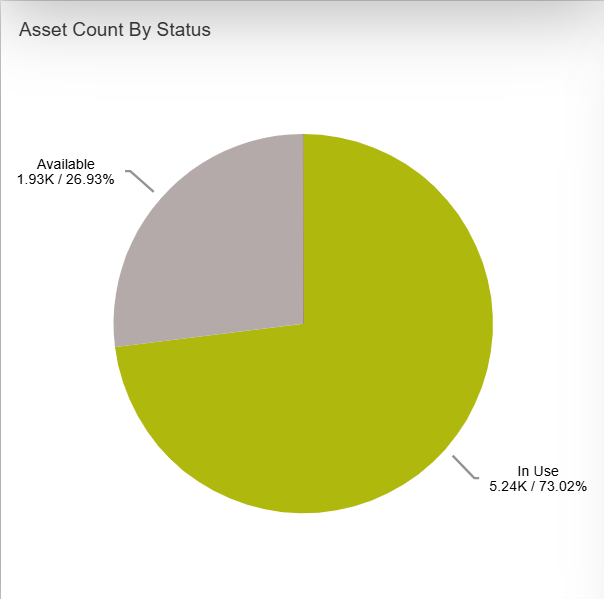
| Asset count by status |
|
|
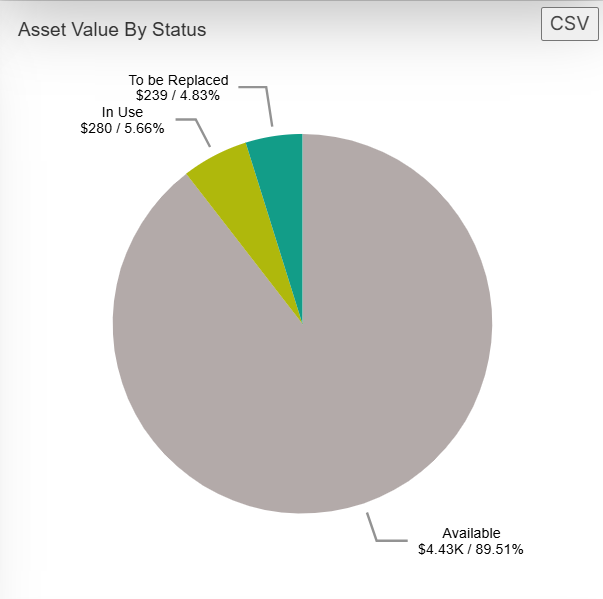
| Asset value by status |
|
|
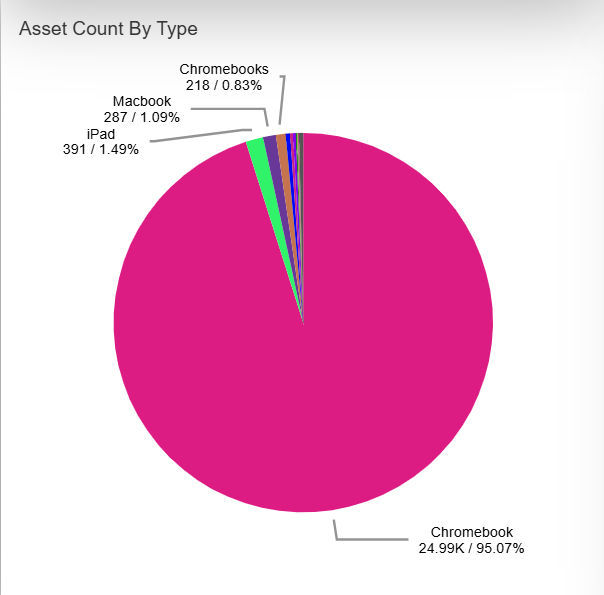
| Asset count by type |
|
|
| Asset value by type |
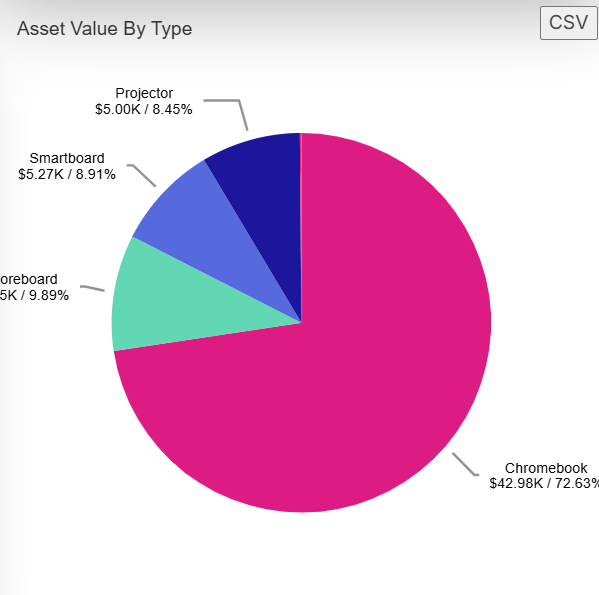
|
|
| Asset count by manufacturer |
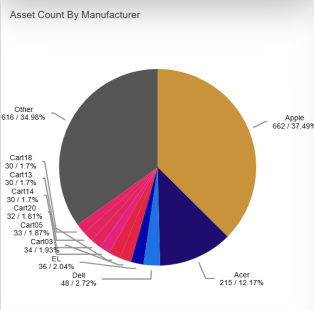
|
|
| Asset value by manufacturer |
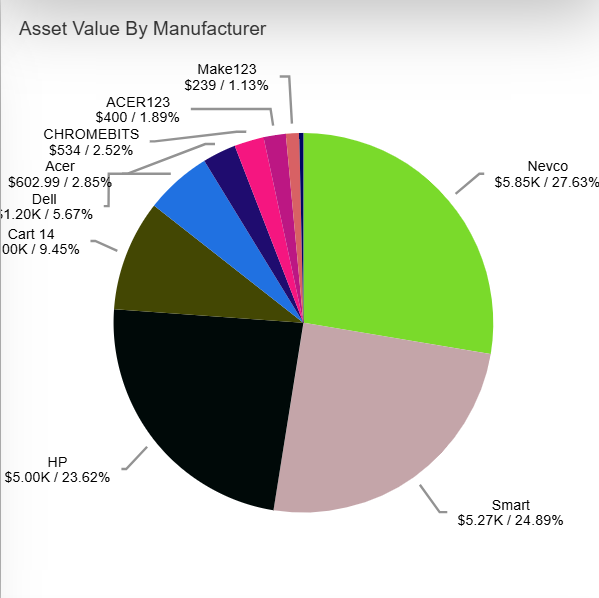
|
|
| Assets by building |
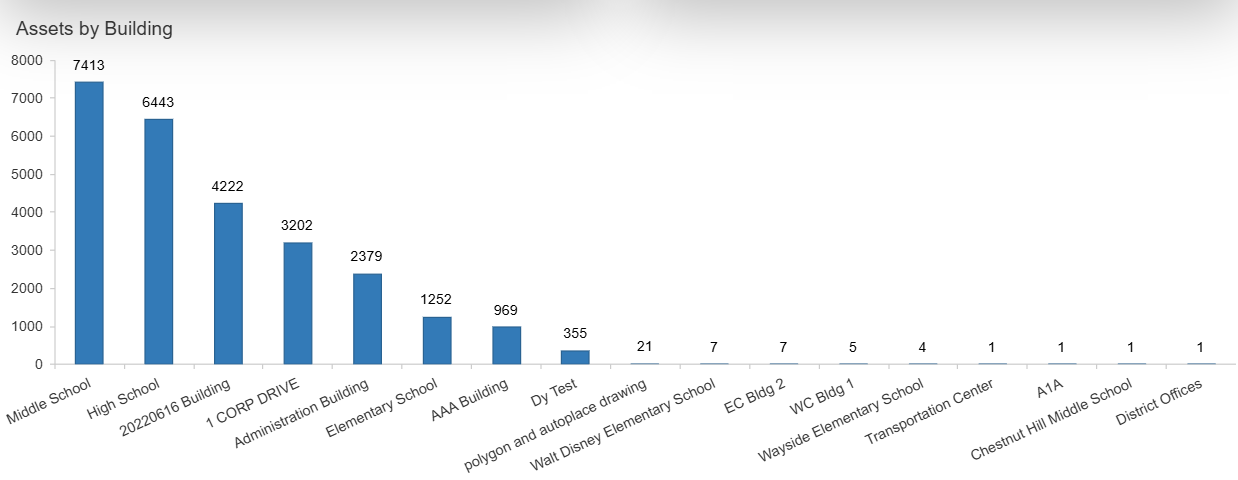
|
- Select Reports > Technology Dashboard.
- Set any filters you want.
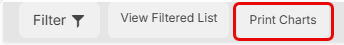
- At the top of the page, select Print Charts.